Projects Finance Report

SenseFlow helps you keep track of your project's financial health.

SenseFlow integrates with your financial system to ensure a closed-loop between billing and accounts. A normalized cost system also allows you to have gross margin estimates in the system so everyone can see if their project is financially healthy. See at a project, team, and individual level how much resources cost and how much you expect to bill for them.

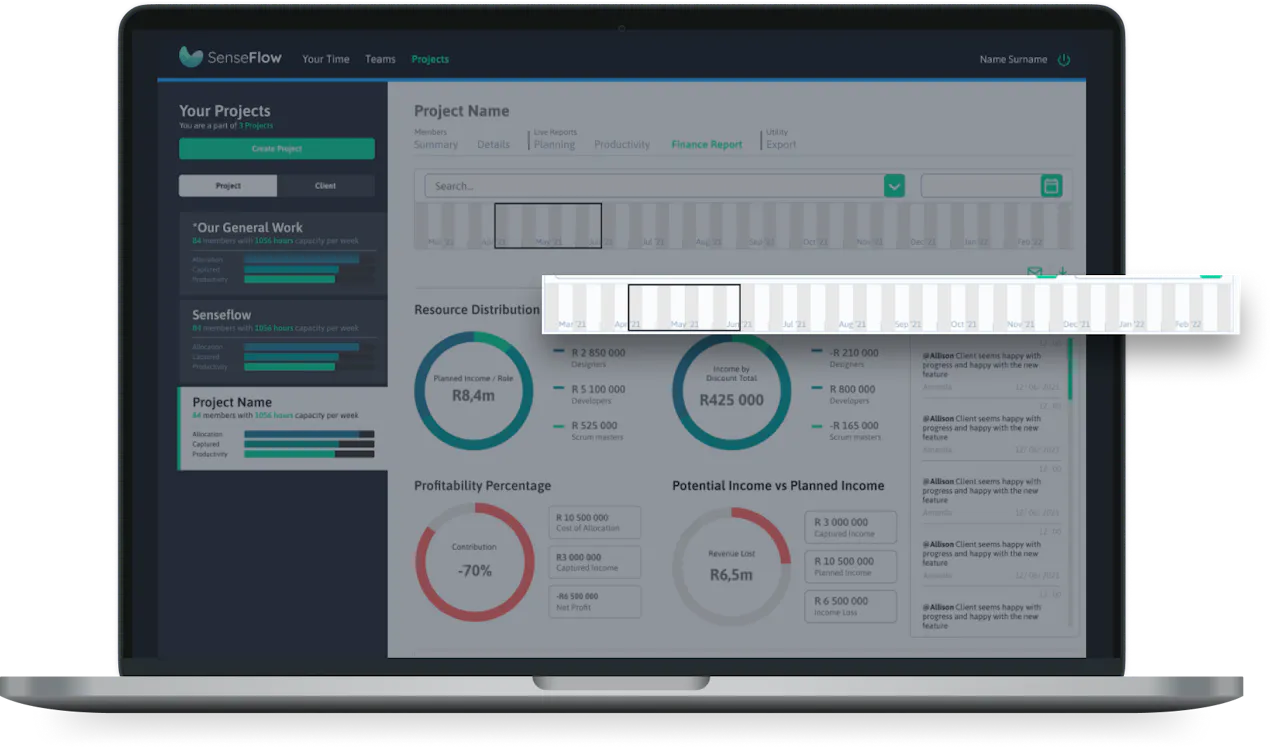
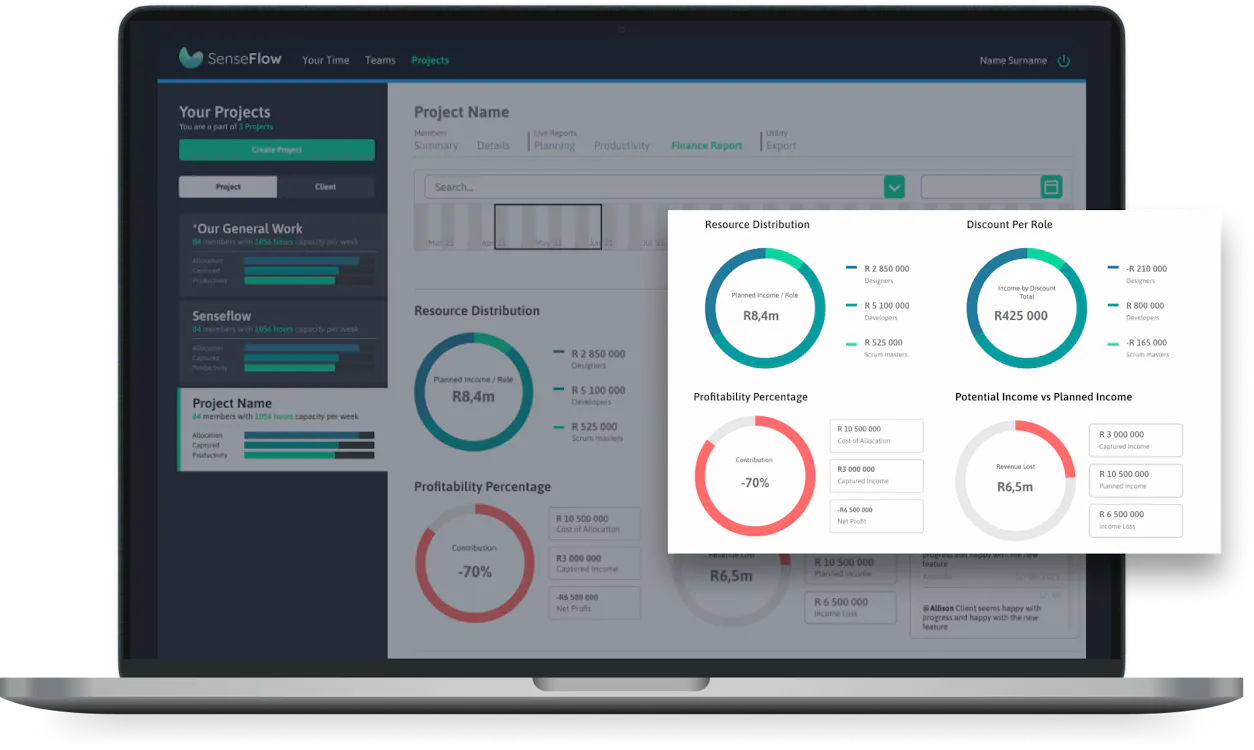
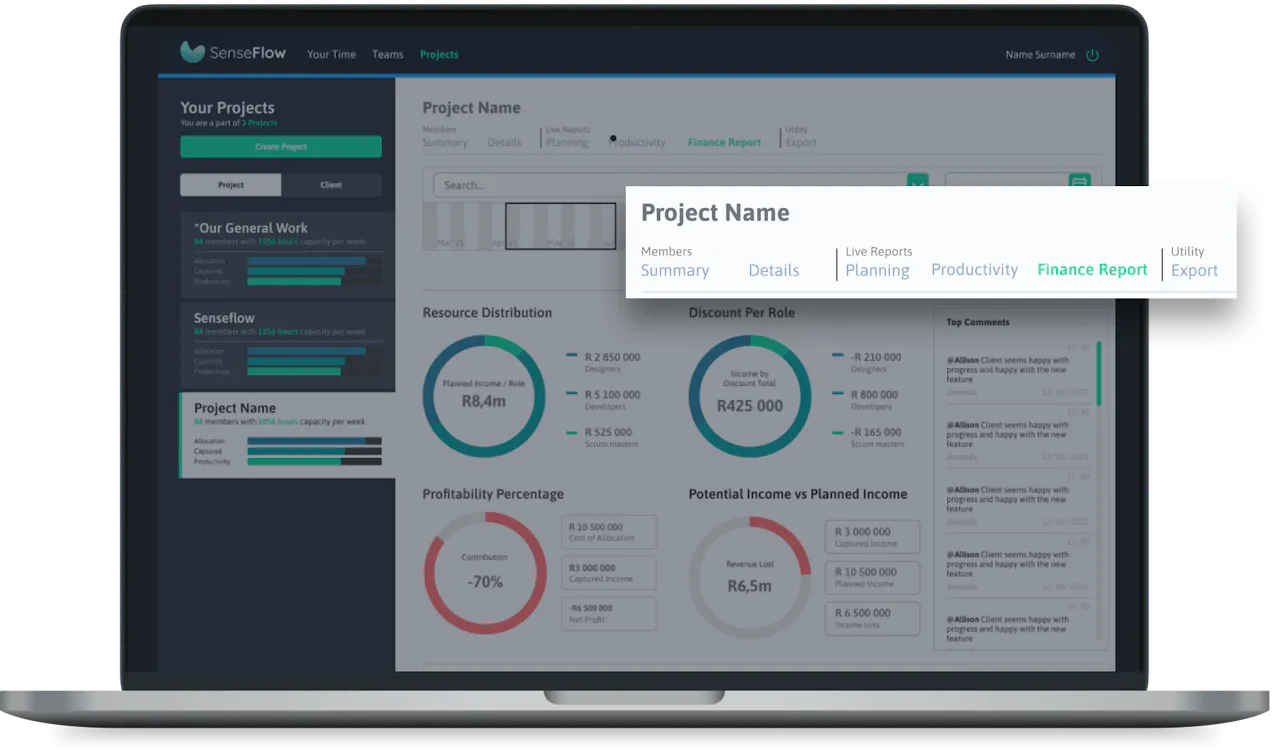
1. Where to find Financial Report

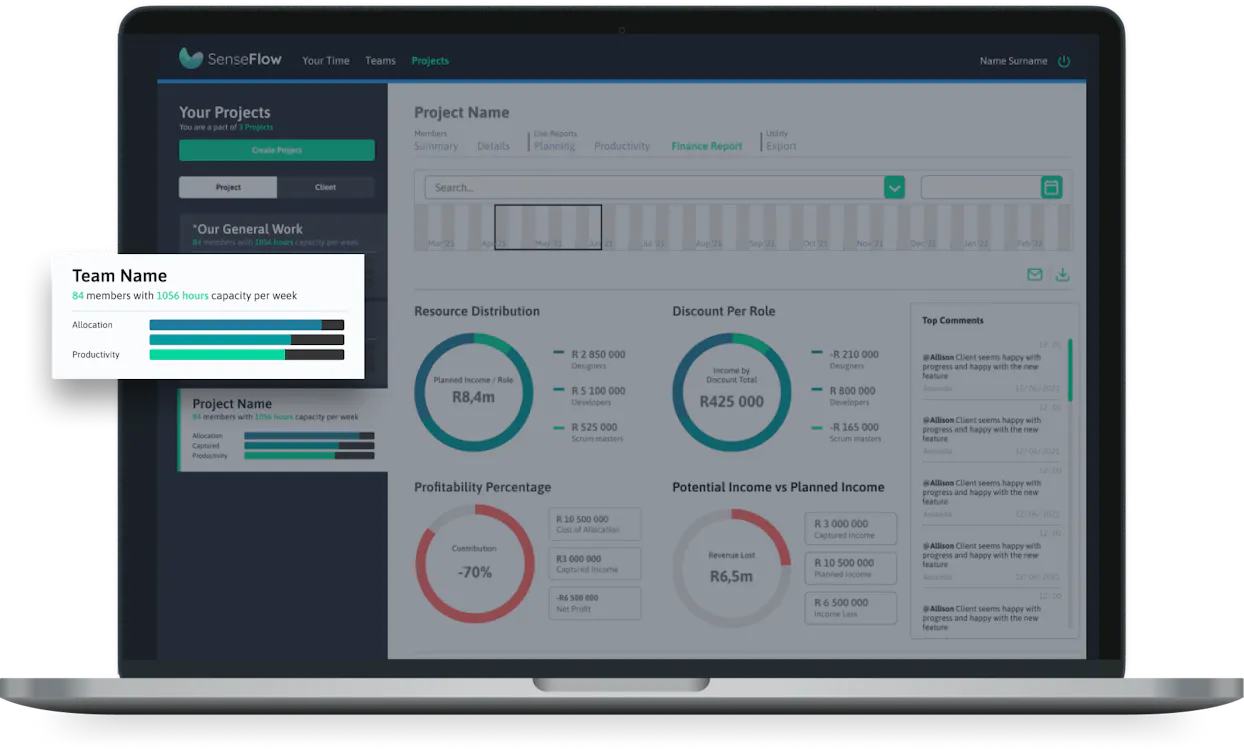
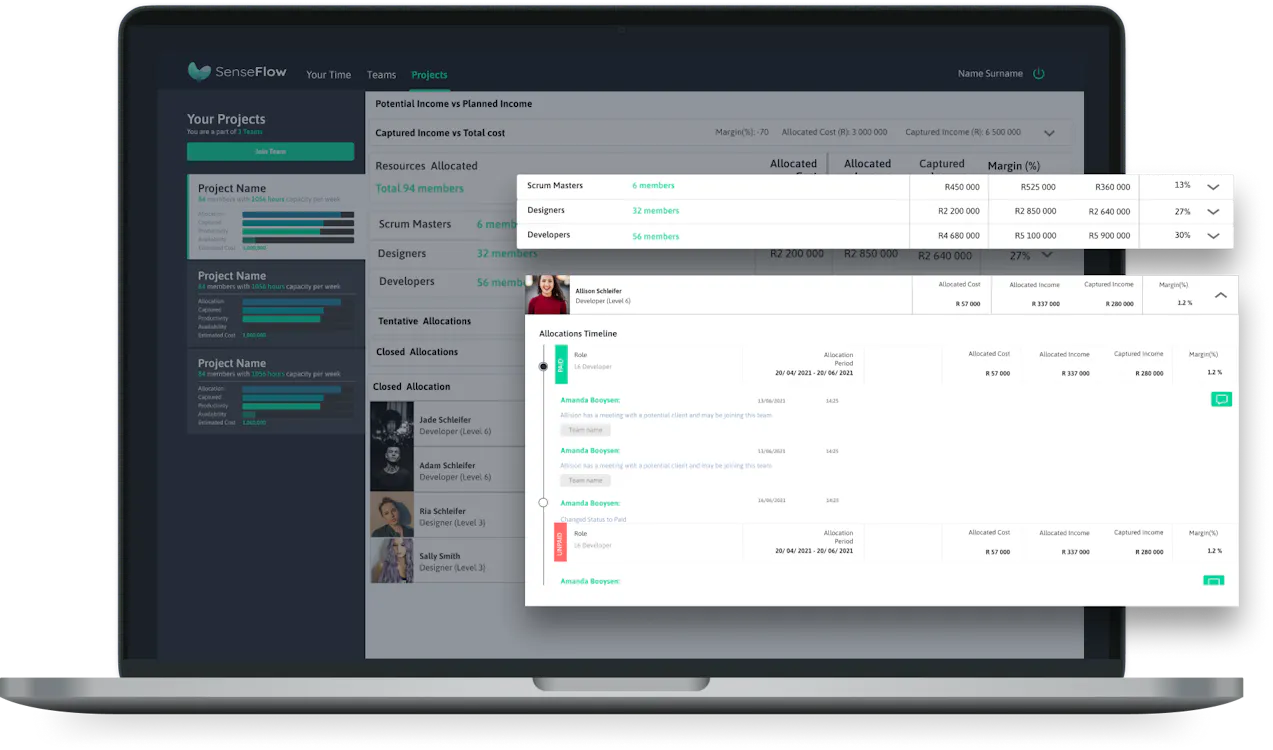
Within SenseFlow you, the project owners and team members are able to find and view the project member summary within the projects section under details. It gives you the chance to see your team's members details.

You will be able to keep track of each team member’s work hours, overtime, capacity, and performance in real-time.

2. Date Range Selector

With the date range selector, you are able to get a to filter through the time period that gives you the chance to view team members within under the project details.

The section is highlighted will show the given information that’s being displayed within the specific time frame on the screen.

3. Team Selection

You can view teams you are assigned to on the left bar. Your team cards allow you to switch between teams and view their specific information. Team cards show you the number of members within a specific team

The allocation bar shows the number of hours allocated to the team members. The captured bar shows the hours' members captured on their journal entries.

The productive bar shows the number of hours out of the captured hours the members were busy on productive tools.

4. Summary of projects Financial Report

The project Financial Report gives you an overview of the financial health of a project. It gives you an insight into the financial standing of your company through 4 graphs:

Resource Distribution gives you a rundown of where you’ve allocated resources based on the project. Summary of the discount and profitability percentage per role, as well as the potential income vs planned income for the project selected.

5. Project Top Comments

The Team Comments are based on the top / recent comments added per team or individual members based on their tentative state or overall project allocations.

The admin team will be able to give comments about each member and they will appear on the left-hand side of the landing page and for easier navigation.

6. Potential Income vs Planned Income

The bar graph shows you the average potential vs planned income of the project for the date period selected.

The x-axis shows the period selected, and the y - axis the days of the week.

Red = Planned Rate

Green = Persons Rate

7. Captured Income vs Allocated Cost

The bar graph shows you the Captured income vs the Allocated Cost of the project for the date period selected.

The x-axis shows the period selected, and the y - axis the days of the week.

Red = Cost
Green = Income
Blue Line = Margin

8. Project Team Members Full View

Click on the dropdown under resources allocated, you will be able to see a member summary. Click the drop-down under a specific member to view their financial report.

The admin will be able to comment on each member's financial status.

Where to find project productivity report

Click on "projects" on the top navigation bar.

Select the project on the sidebar you want to view.

Click on "finance" under the reports to view the project's finance report.

How to select the date range

You can drag the bar on the date range to view the finance report information for a specific period.

How to share/download the finance report

Click the envelope icon to email the report. To export the report you can select the download icon.

How to view finance graphs

Click on the dropdown arrow far right on the bar to view/expand the potential vs planned graph.

Click on the dropdown arrow far right on the bar to view/expand the captured income vs total cost graph.

How to view members for resources allocated

Click on the dropdown arrow far right on the specific resource bar to view/expand the members.

Click on the dropdown arrow far right on the member card to view/expand their profile. Here you would be able to see their allocation history on a timeline and leave comments.

You can click the "comment" speech bubble icon to leave a comment on a member's profile on the finance report.

How to view tentative allocations on project

Click on the dropdown arrow far right on the bar to view/expand all tentative members. Here you would be able to see the member cards and expand on their profiles.

How to view closed allocations

Click on the dropdown arrow far right on the bar to view/expand all closed allocations. Here you would be able to see the member cards and expand on their profiles to see the comments made under their profiles

How to filter members

Click on the dropdown arrow on the search bar to view filter options, or you can start typing a specific member name, role, level, or skill. The member cards will be filtered by selected tags.

You can select from the dropdown more than one filter option. The filter options selected will appear in the search bar. To remove a filter "tag" you can click on the X to delete it.