1. Where to find Financial Report
Select projects on the top navigation bar
Click on Finance to access the Financial Report page.
SenseFlow integrates with your financial system to ensure a closed-loop between billing and accounts. A normalized cost system also allows you to have gross margin estimates in the system so everyone can see if their team is financially healthy. See at a project, team, and individual level how much resources cost and how much you expect to bill for them.
Select projects on the top navigation bar
Click on Finance to access the Financial Report page.
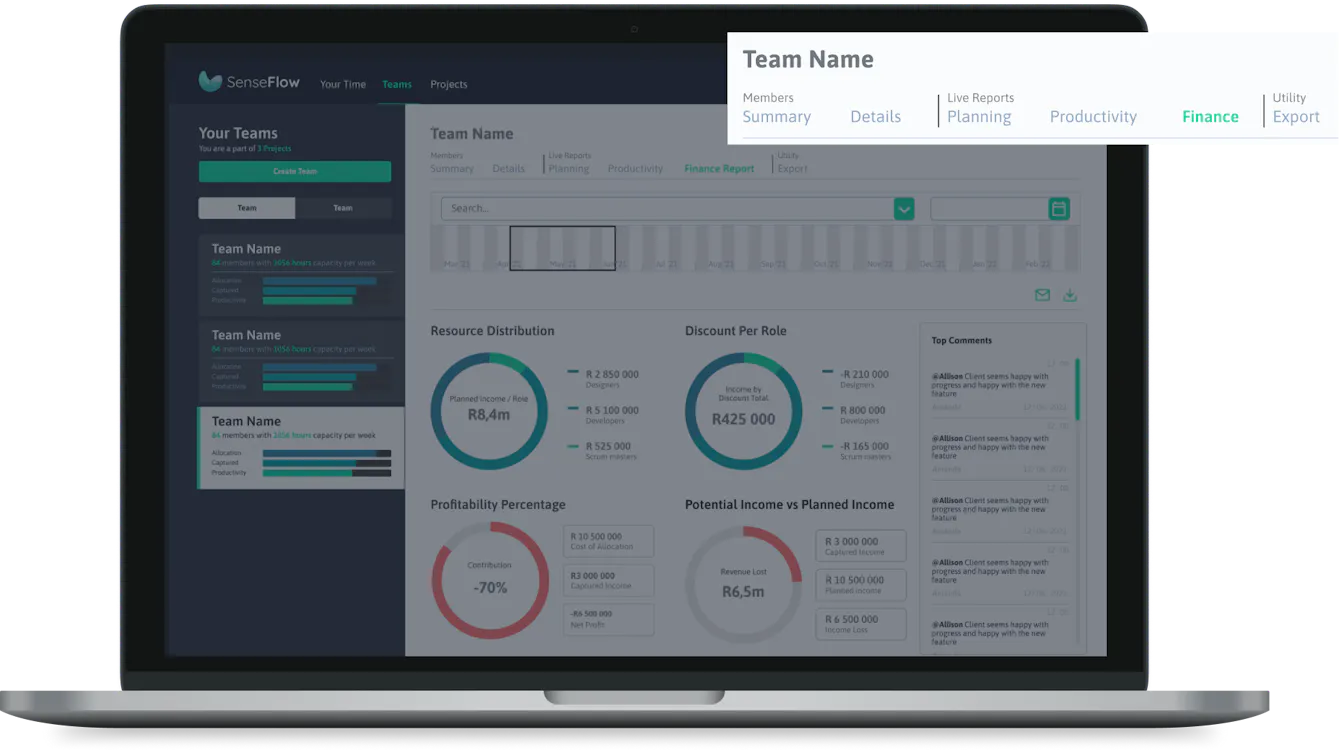
The team Financial Report gives you an overview of the financial health of a team. It gives you an insight into the financial standing of your company through 4 graphs:
Resource Distribution gives you a rundown of where you’ve allocated resources based on teams. Summary of the discount and profitability percentage per role, as well as the potential income vs planned income for the teams, selected.
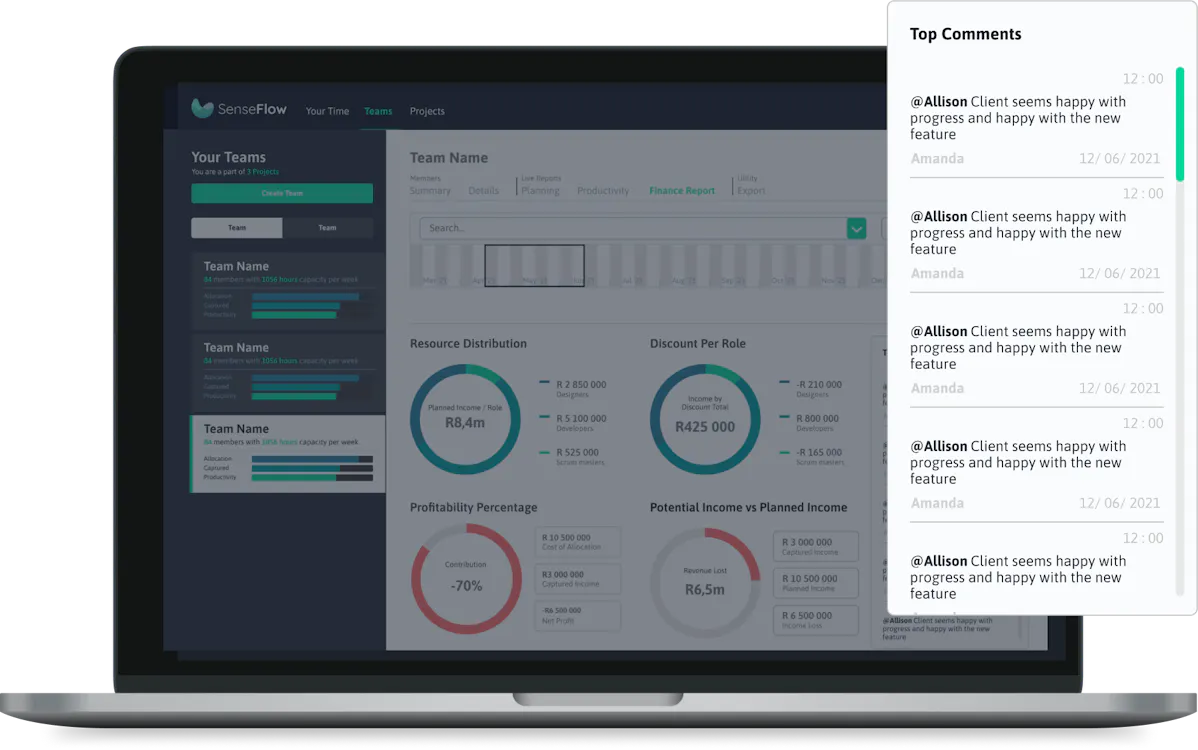
The Team Comments are based on the top / recent comments added per team or individual members based on their tentative state or overall project allocations.
The admin team will be able to give comments about each member and they will appear on the left-hand side of the landing page and for easier navigation.
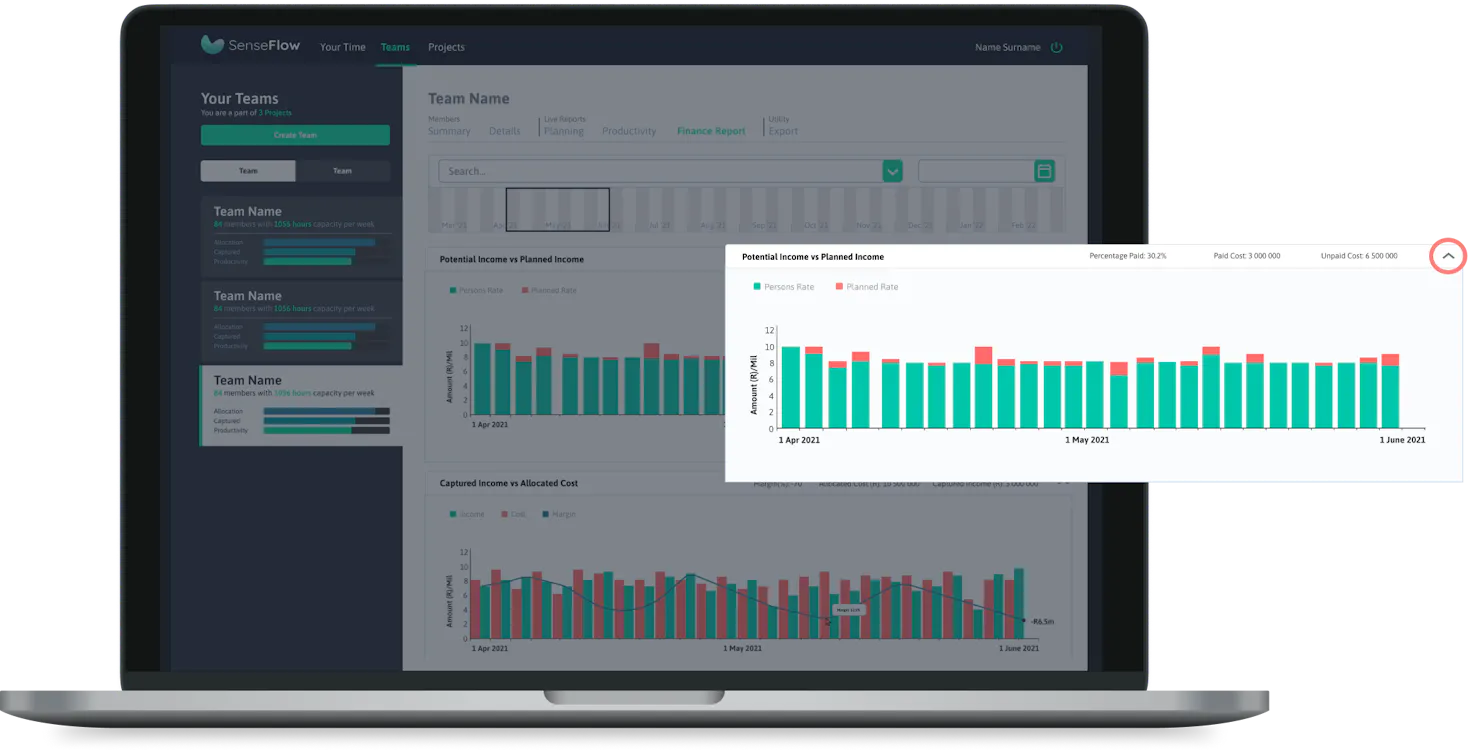
The bar graph shows you the average potential vs planned income of the project for the date period selected.
The x-axis shows the period selected, and the y - axis the days of the week.
Red = Planned Rate
Green = Persons Rate

In the secondary menu, you will find other menu items click on. 'Click on 'Finance' to access it.

You can either select the two endpoints of the highlighted area and drag them OR you can select it from the date picker next to the search bar above.

Once you have landed on the financial report section and scroll to the first section you will get an overview of the financial performance of the team

The team top comments are like live feedback of a team's activity on SenseFlow. And this is pulled from comments made on a specific individual. Any user that has access to this feature will be allowed to do so

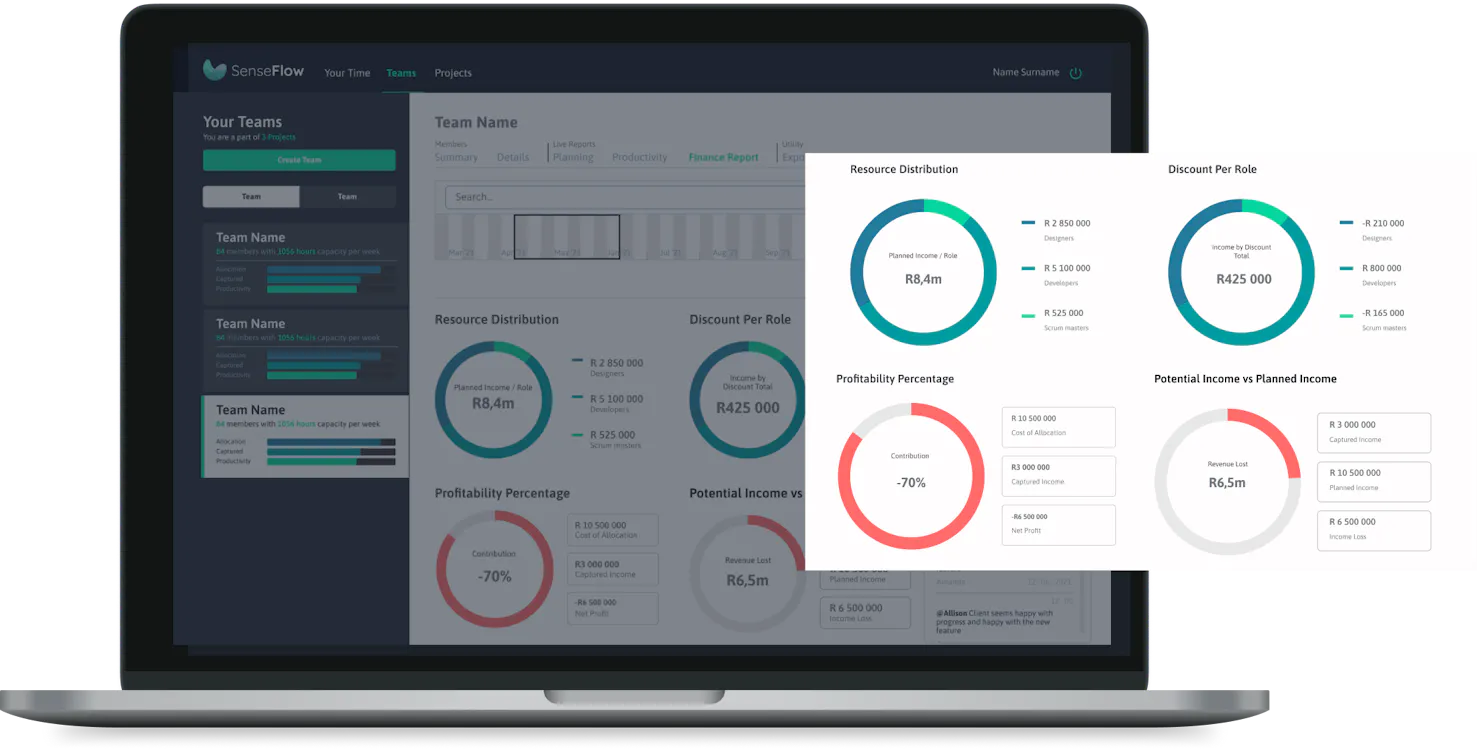
When you scroll even further down the financial report page you will be able to see the resource distribution data. You will see drop down arrows and if you click on them you will get a better view of how the resources are distributed across different departments in a team.

The drop-down below the resource distribution data is the Potential income vs Planned income. When you click on that drop-down, this shows the progress and performance of a team using high-level metrics in a bar graph.

The third drop-down just below the resource allocated data and potential Income vs planned Income is the captured income vs allocated cost. When you click on that drop-down you will find another kind of bar graph that displays the progress and performance of the team.

The last thing at the bottom of the financial report is the individual team member full view where you can see how they are utilized in a team setting. You can also add comments which will be displayed in the individual members section as well as the top comments block at the top.


